Page 43 - PITTURE E VERNICI EUROPEAN COATINGS Issue 3/May-June 2017
P. 43
LABORATORY
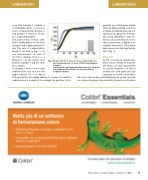
seen that Sample 1 exhibits a considerably faster increase in mass compared with Sample 2 and Sample 3, which is shown by comparable graphs.
The total increase in mass after 600 s hardly differs for all three samples and is approximately 10 mg. The rate of sedimentation dm/dt is plotted in Fig. 3 for one measurement on each of the three samples. Here too, a difference can be clearly seen between Sample 1 and the other two samples.
Fig. 2
Characteristic of mass increase against time for two measurements on each of three investigated samples
Caratteristica dell’aumento della massa in funzione del tempo per due misure su ciascuno dei tre campioni studiati
garantito una distribuzione iniziale uniforme delle particelle. La misura è iniziata immediatamente dopo le operazioni di agitazione. A tal fine, una sonda (SH0640) è stata im- mersa a una profondità di 20 mm nella sospensione, collegata a un software informatico. Gli aumenti della massa sono stati registrati per 600 s (Fig. 1).
RISULTATI
La Fig. 2 mostra la caratteristica della massa rilevata in funzione del tempo per due esperimenti su ciascun campione 1-3. Qui, si osserva che i due grafici per ogni campione sono molto simili, vale a
LABORATORIO
For Sample 1, there is a constant
sedimentation rate over the first
approximately 45 s of about
100 μg/s before this rapidly reduces to a value of 0 and the sedimentation is complete. Accordingly, the particles in this
dire che la risposta alla sedimentazione può essere misurata con un buon margine di riproducibilità. Quando si confrontano
Pitture e Vernici - European Coatings - Formulation 3 / 2017 39