Page 22 - PITTURE E VERNICI EUROPEAN COATINGS FORMULATIONS:Issue 3/May-June 2016
P. 22
POLYOLS POLIOLI
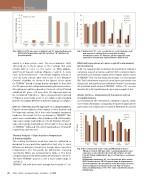
Fig. 2 Effect of UV exposure on Hunter Lab “b” value (yellowness)
Effetti dell’esposizione agli UV sul valore “b” Hunter Lab (tonalità gialla)
and b is a blue-yellow scale. The most dramatic sihfts observed are in the b values of the coatings that were initially light in color, i.e. the castor oil, DEG adipate, and Poly-G® based coatings (Figures 2 and 3). In every case, b increased from ~+10 initially (slightly yellow) to over 40 (very yellow) after 500 hours in the Weather- Ometer® chamber. As shown in the figures, the b values for TERRINTM based coatings barely changed, so that after the UV exposure all coatings had similar b (yellowness) values. All coatings except those based on Castor oil or Poly G® blend exhibited 60° gloss >70 even after UV exposure and can be considered “high gloss.” Gloss measurements reported in Figure 4 were made at 20° in accordance with standard practice to magnify differences between high gloss samples.
Effects of thermal and UV exposure on coating hardness
Figure 5 shows hardness of the original, control, thermal- and UV-exposed coatings. All of the control samples had pencil hardness 2H except for the one based on TERRINTM 168, which was considerably softer at hardness HB. All thermally- exposed coatings had hardness 2H. All Weather-Ometer®- exposed coatings had hardness 2H except for those based on TERRINTM 168G and 170, which had hardness 3H and 4H respectively after the test.
Thermal Analysis – Glass transition temperature
& thermal stability
The coating formulation used here was not optimized or designed for any particular application, but only to show differences between the polyols tested. Glass transition temperatures (Tg) measured by differential scanning calorimetry (DSC) are summarized in Table 4. The three comparison polyols fell within a fairly narrow range of ~20-24°C. The three TERRINTM polyols cover a much wider range of ~10-40°C.
TERRINTM 168, with the lowest average functionality of ~1.8,
Fig. 3 Hunter Lab “b” color coordinate of control (unexposed) and exposed coatings before and after testing) Coordinate colore “b” Hunter Lab del campione (non esposto) e rivestimenti esposti prima e dopo il test
Effetti dell’esposizione al calore e agli UV sulla durezza dei rivestimenti
In fig. 5 è rappresentata la durezza dei rivestimenti originali a campione, esposti al calore e agli UV. Tutti i campioni hanno presentato una durezza a matita 2H eccettuato quello a base di TERRINTM 168, che era molto più morbido con una durezza HB. Tutti i rivestimenti esposti al calore hanno presentato una durezza 2H, tutti quelli esposti a Weather-Ometer® una durezza 2H eccettuati quelli a base di TERRINTM 168G e 170, con una durezza 3H e 4H rispettivamente dopo aver eseguito il test.
Analisi termica – temperatura di transizione vetrosa
& stabilità termica
La formulazione del rivestimento utilizzata in questo studio non è stata ottimizzata o sviluppata per qualche applicazione particolare, ma soltanto per mostrare le differenze fra i polioli
20° Gloss
20 Pitture e Vernici - European Coatings - Formulation 3 / 2016
Fig. 4 Gloss measured at 20° using a BYK-Gardner micro- TRI-gloss meter 200 days after coating preparation and exposure as described in the text. All samples except Poly-G® blend exhibited 60° gloss >70 and are considered high gloss
Brillantezza misurata a 20° con l’ausilio del gloss-meter BYK Gardner micro TRI 200 giorni dopo la preparazione del rivestimento ed esposizione come descritta nel testo. Tutti i campioni eccettuata la miscela Poly-G® hanno dato una brillantezza a 60°>70 e sono considerati ad alta brillantezza